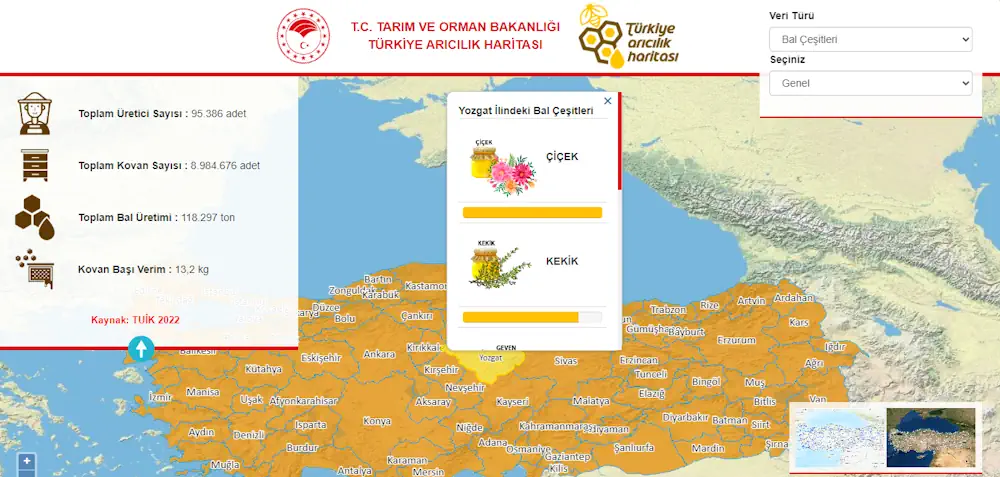
Türkiye Arıcılık Haritası Güncellendi
Tarım ve Orman Bakanı İbrahim Yumaklı, Türkiye Arıcılık Haritası’nın güncellendiğini belirterek, “Böylece arıcılarımız, illerin flora çeşitliliği ile bitkilerin çiçeklenme dönemlerine, bal ormanı alanları ile kovan kapasitelerine ulaşma imkanı bularak arılarını hangi bölgeye, hangi dönemde, hangi çiçek için götüreceklerini belirleyebilecekler” dedi. Bakanlığa bağlı Hayvancılık Genel Müdürlüğü tarafından arıcılığın geliştirilmesi ve bal üretiminin artırılması amacıyla projelendirilen ve ...
cnnturk.com